Fluorescence spectroscopy is a highly sensitive analytical technique used to study molecules based on the light they emit after absorbing energy. It is widely used in life sciences, biotechnology, pharmaceutical research, clinical research, materials science, environmental analysis, and quality control laboratories.
In simple terms, fluorescence spectroscopy works by Irradiating the sample with a specific wavelength of light and measuring the light emitted by fluorescent molecules. The emitted light provides valuable information about molecular structure, concentration, binding interactions, cellular processes, and chemical environment.
Table of Contents
- What is Fluorescence Spectroscopy?
- Jablonski Diagram
- Fluorescence vs Phosphorescence
- Important Concepts
- Instrumentation
- How Fluorescence Spectroscopy Works
- Types of Measurements
- Factors Affecting Fluorescence
- Applications in Life Sciences
- Relevant Product Solutions
- Advantages and Limitations
- Common Problems and Solutions
What is Fluorescence Spectroscopy?
Fluorescence spectroscopy is an analytical method used to measure the fluorescence emitted by a substance after it absorbs light. When a molecule absorbs light of a suitable wavelength, its electrons move from a lower energy state to a higher energy state. The excited molecule is unstable and quickly returns to a lower energy state by releasing part of the absorbed energy as emitted light.
This emitted light is called fluorescence. The intensity and wavelength of fluorescence can be measured to understand the nature, concentration, structure, environment, and behavior of the molecule being studied.
The technique is especially useful because many biological molecules, fluorescent dyes, proteins, nucleic acid probes, biomarkers, and assay labels can emit fluorescence. This makes fluorescence spectroscopy highly valuable in life sciences and biomedical research.
Principle of Fluorescence Spectroscopy
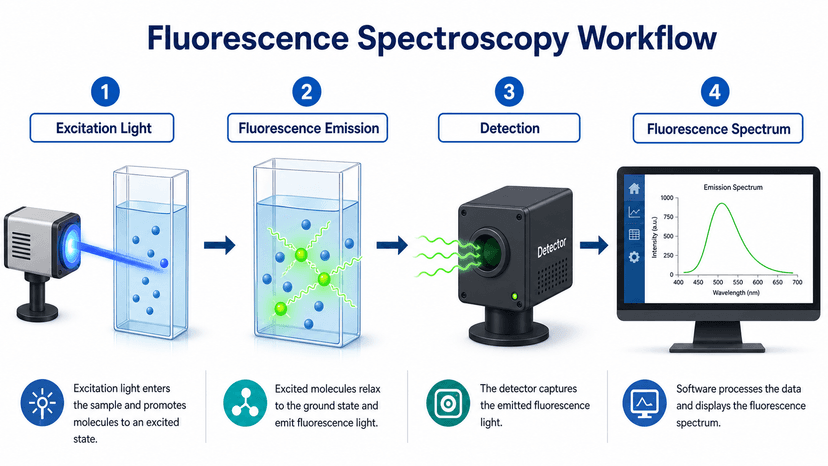
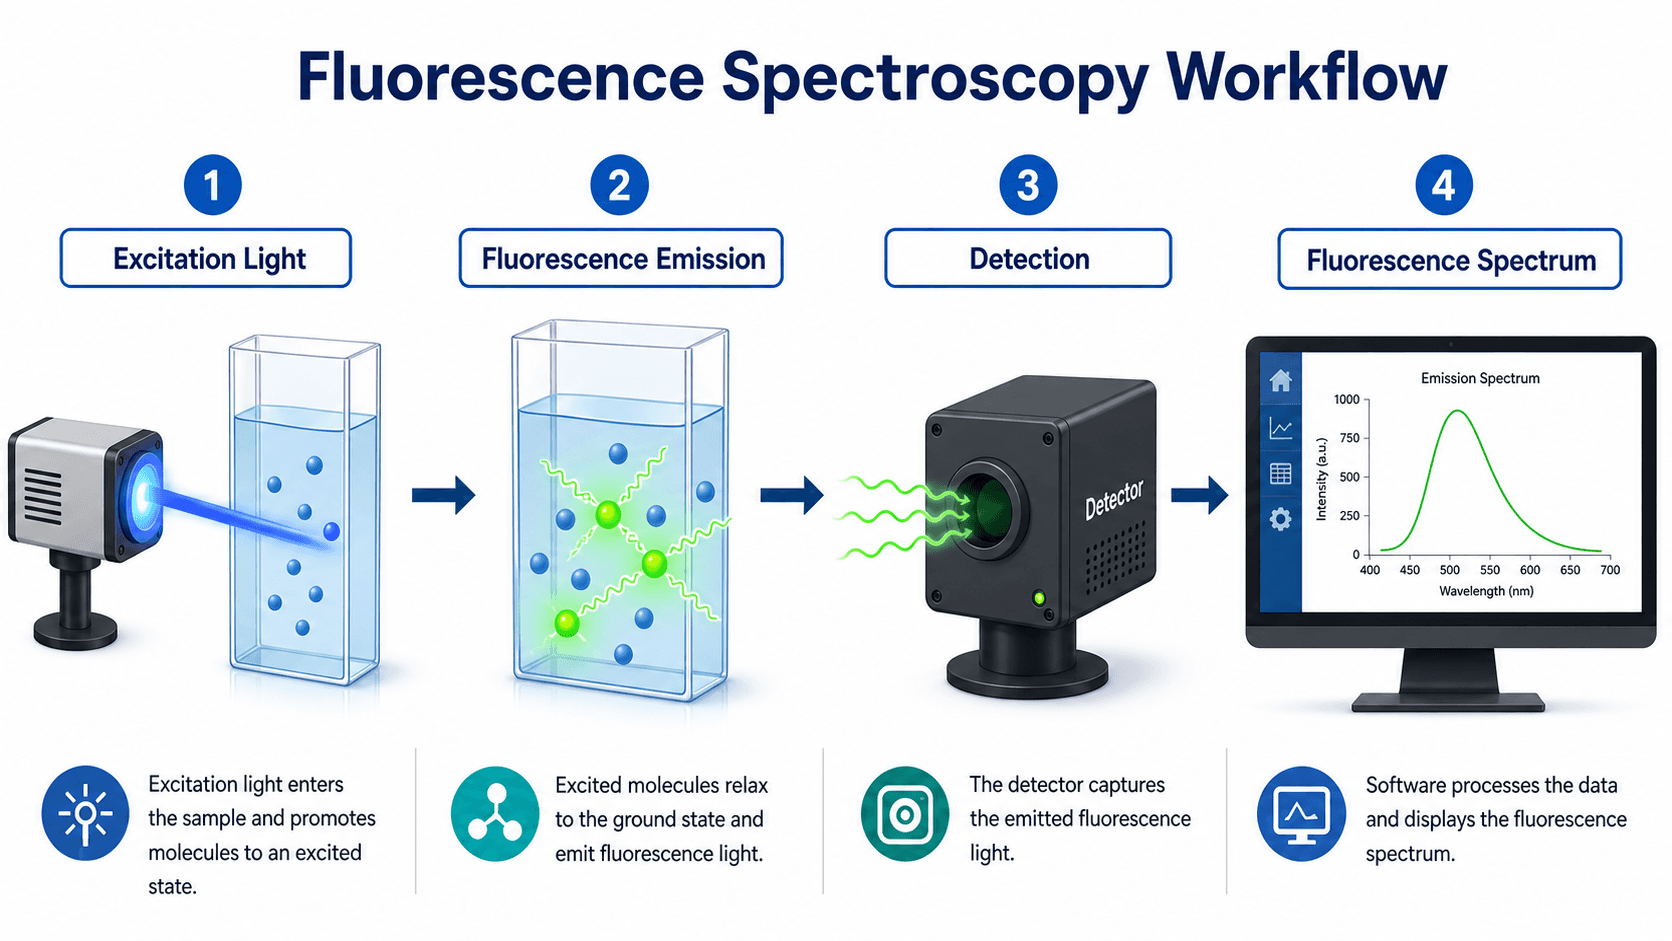
The principle of fluorescence spectroscopy is based on four main steps: excitation, vibrational relaxation, fluorescence emission, and detection.
1. Excitation
A fluorophore (molecule capable of exhibiting fluorescence) absorbs light of a specific wavelength. This absorbed energy promotes electrons from the ground electronic state to an excited electronic state. The excitation wavelength must match the energy gap between ground and excited electronic states of the molecule.
2. Vibrational Relaxation
After excitation, the molecule loses part of its absorbed energy through non-radiative relaxation processes. This energy may be lost as heat or through interaction with the surrounding environment.
3. Fluorescence Emission
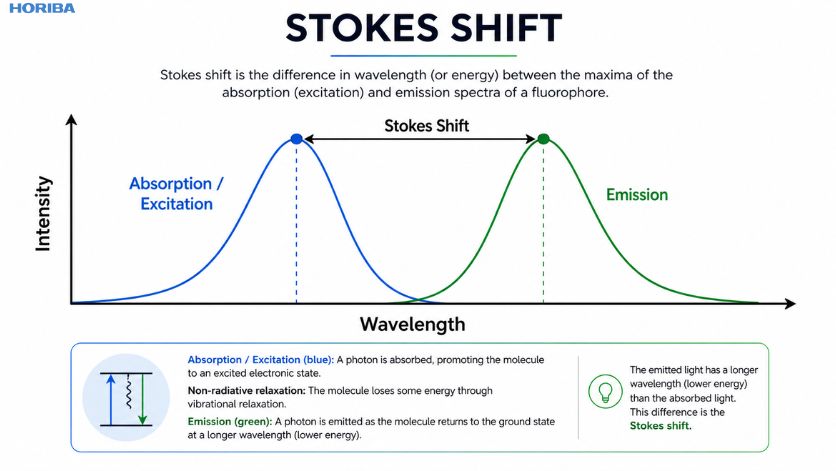
The molecule returns from the excited state to a lower energy state and emits a photon. Since some energy has already been lost before emission, the emitted photon usually has lower energy and a longer wavelength than the absorbed photon.
4. Detection
The emitted fluorescence is collected by the spectrometer, separated into constituent wavelengths, detected, and converted into a measurable signal. The final output is usually shown as a fluorescence spectrum, where intensity is plotted against wavelength.
Jablonski Diagram: Understanding Fluorescence Transitions
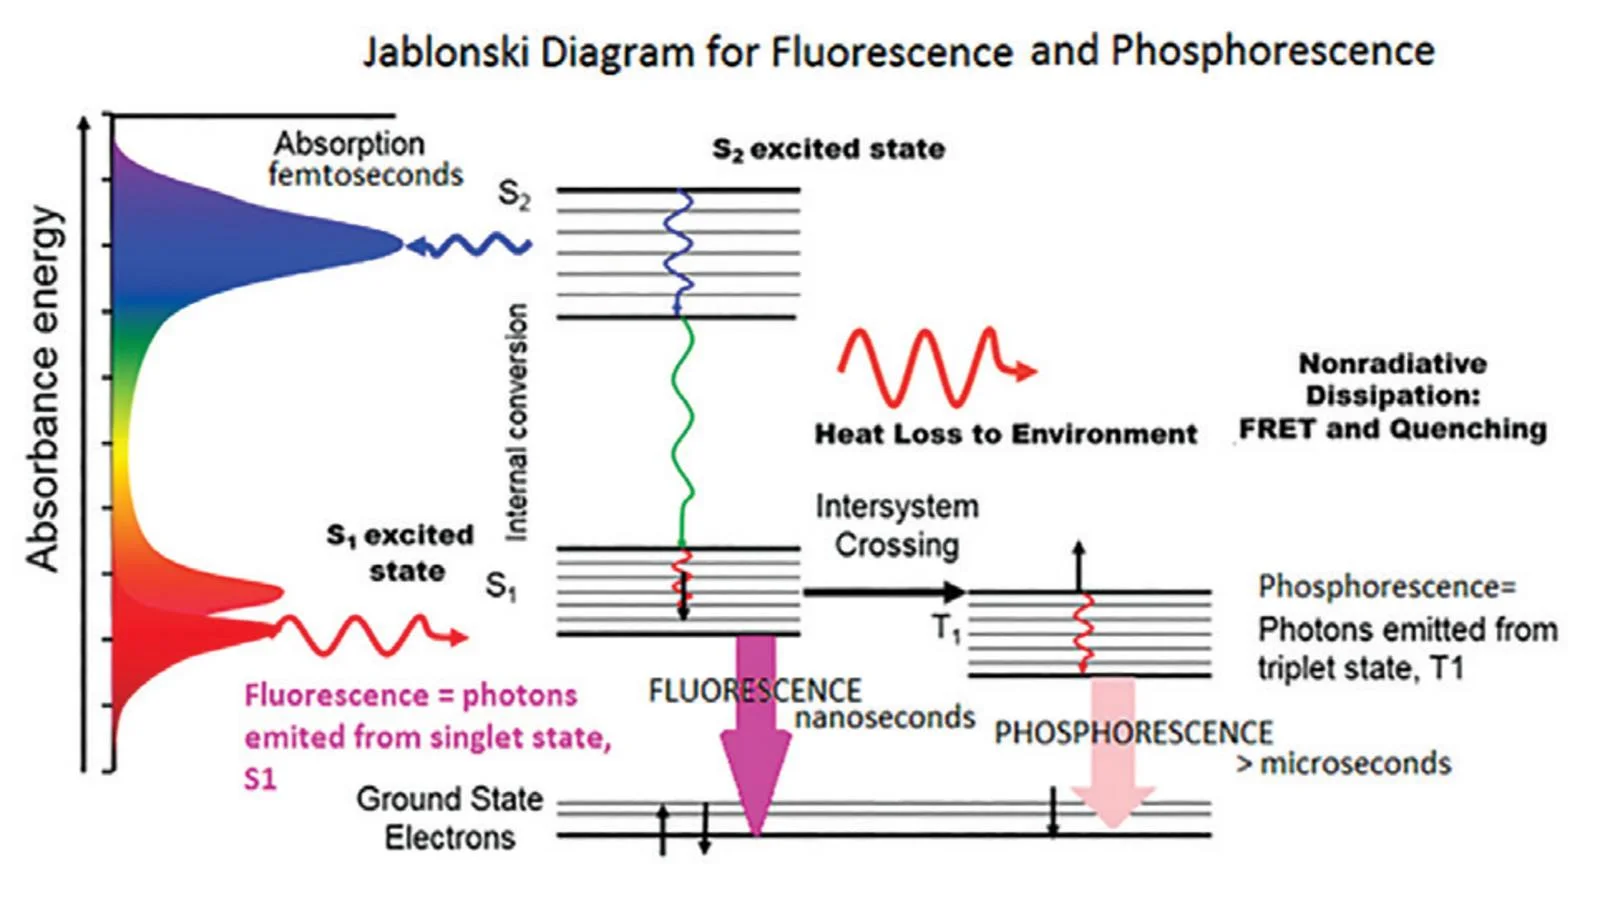
A Jablonski diagram is commonly used to explain the electronic transitions involved in fluorescence. It shows the complete process beginning from absorption of light to excited state processes like non-radiative decay, internal conversion, intersystem crossing and fluorescence and phosphorescence emission.
Key elements in a Jablonski diagram
- Ground state: The normal low-energy state of the molecule.
- Excited singlet state: Higher energy state reached after light absorption.
- Internal conversion: Transition between excited singlet states.
- Vibrational relaxation: Non-radiative loss of energy before emission.
- Fluorescence: Emission of light as the molecule returns to a lower energy state.
- Intersystem crossing: Transition from singlet to triplet state.
- Phosphorescence: Delayed emission from the triplet state.
Fluorescence vs Phosphorescence
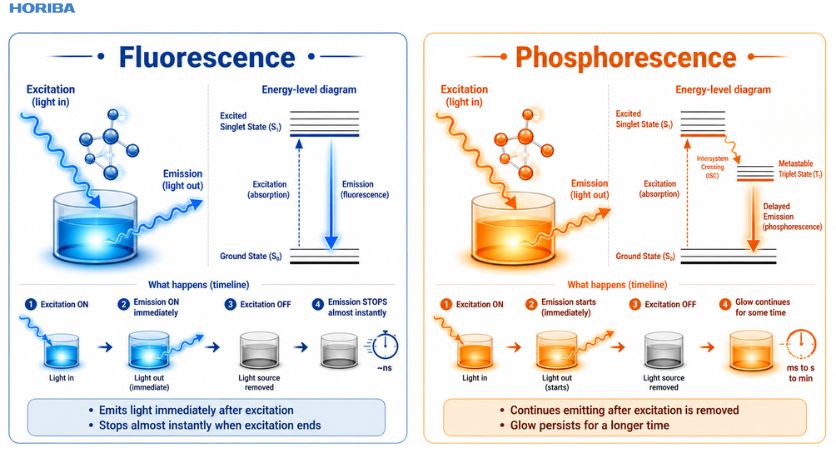
Fluorescence and phosphorescence are both forms of luminescence, but they differ in the emission lifetimes and mechanism of light emission. Fluorescence occurs almost immediately after light absorption and stops quickly when the excitation source is removed. Phosphorescence is delayed and may continue even after the excitation source is turned off.
| Parameter | Fluorescence | Phosphorescence |
|---|---|---|
| Emission speed | Fast | Delayed |
| Excited state involved | Singlet excited state | Triplet excited state |
| Emission after light source removal | Stops quickly | Can continue for some time |
| Typical emission time | Nanoseconds range | Microseconds to seconds or longer |
| Common use | Molecular analysis, bioassays, imaging, quantification | Long-lived emission studies, phosphorescent materials, delayed detection methods |
Important Concepts in Fluorescence Spectroscopy
Stokes Shift
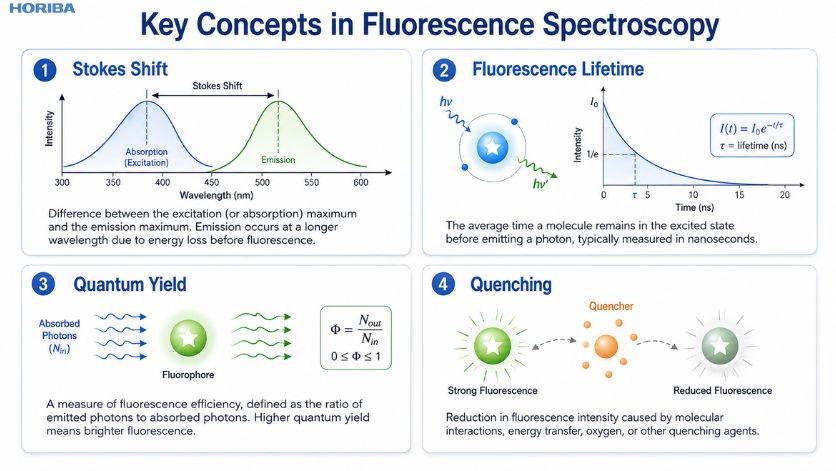
Stokes shift is the difference between the wavelength of maximum absorption or excitation and the wavelength of maximum fluorescence emission. Since part of the absorbed energy is lost before emission, fluorescence usually occurs at a longer wavelength than excitation.
Fluorescence Lifetime
Fluorescence lifetime is the average time a molecule remains in the excited state before emitting a photon. It is typically measured in nanoseconds. Fluorescence lifetime is useful because it provides information about the molecular environment, interactions, energy transfer, and quenching processes.
Quantum Yield
Quantum yield describes how efficiently a molecule emits fluorescence. It is the ratio of the number of photons emitted to the number of photons absorbed. A molecule with high quantum yield emits fluorescence efficiently and appears brighter.
Fluorophore
A fluorophore is a molecule or chemical group that can absorb light and emit fluorescence. Fluorophores may be naturally present in biological systems or added as fluorescent dyes, labels, probes, or tags.
Quenching
Quenching is the reduction of fluorescence intensity due to molecular interactions, energy transfer, collisions, oxygen, halides, heavy metals, or complex formation. Quenching can be a problem in fluorescence measurements, but it can also be used intentionally to study molecular interactions and biological processes.
Instrumentation of Fluorescence Spectroscopy
Fluorescence spectroscopy is usually performed using a fluorescence spectrophotometer or spectrofluorometer. The instrument excites the sample with a selected wavelength of light, collects the emitted fluorescence, separates the emitted wavelengths, detects the signal, and generates a spectrum.
A typical fluorescence spectroscopy instrument includes a light source, excitation monochromator or filter, sample holder, emission monochromator or filter, detector, and data processing system.
Main Components of a Fluorescence Spectrophotometer
| Component | Function | Common Examples |
|---|---|---|
| Light Source | Provides the excitation energy required to excite fluorophores in the sample. | Xenon lamp, mercury lamp, laser, LED |
| Excitation Monochromator or Filter | Selects the specific excitation wavelength before light reaches the sample. | Diffraction grating, optical filter |
| Sample Holder | Holds the sample in the correct optical path and geometry. | Cuvette, microplate, slide, flow cell, fiber-optic probe |
| Emission Monochromator or Filter | Selects the emitted fluorescence wavelength and reduces unwanted scattered light. | Diffraction grating, optical filter |
| Detector | Converts emitted fluorescence into an electrical signal. | Photomultiplier tube, photodiode, avalanche photodiode |
| Data System or Software | Processes the detector signal and generates spectra, intensity readings, kinetic curves or maps. | Instrument control and analysis software |
Why is fluorescence commonly detected at 90 degrees?
In many fluorescence spectrophotometers, the detector is positioned at a 90-degree angle to the excitation light path. This geometry helps reduce interference from the excitation beam and scattered light. Since fluorescence is emitted in multiple directions, collecting it at 90 degrees improves signal quality and helps isolate the actual fluorescence signal.
How Does Fluorescence Spectrometer Work?
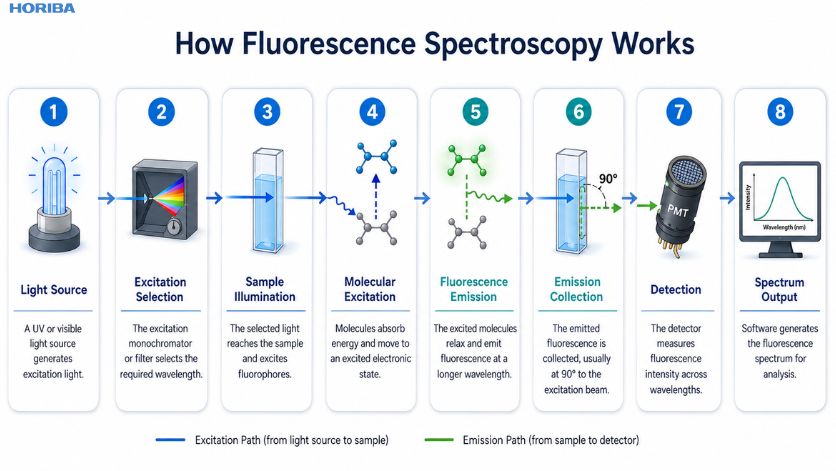
The working of fluorescence spectrometer can be understood as a step-by-step optical measurement process.
- The light source emits UV or visible light.
- The excitation monochromator or filter selects the required excitation wavelength.
- The selected excitation light reaches the sample placed in the sample holder.
- Fluorophores in the sample absorb light and move to an excited state.
- The fluorophores relax and emit fluorescence at a longer wavelength.
- The emitted light is collected, usually at 90 degrees from the excitation path.
- The emission monochromator or filter separates the fluorescence signal into constituent wavelengths.
- The detector records fluorescence intensity.
- The software generates a fluorescence spectrum or quantitative output.
Types of Fluorescence Measurements
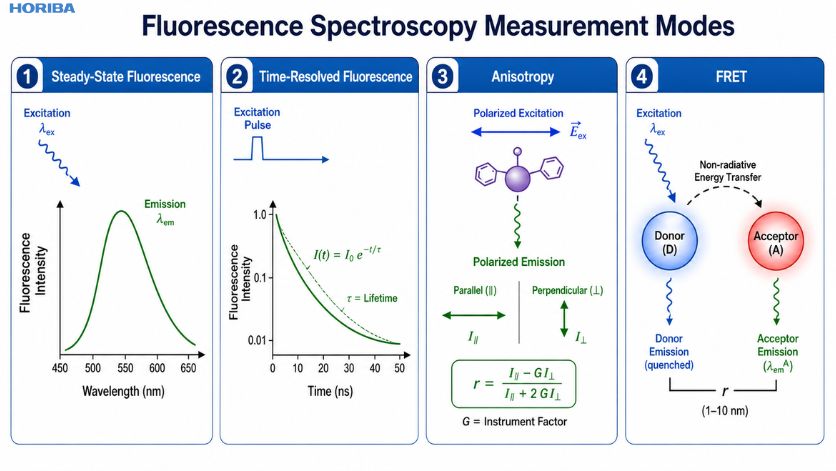
Fluorescence spectrometer can be used in different measurement modes depending on the type of information required. Some methods are routine and intensity-based, while others are advanced and used for studying molecular interactions, dynamics, and imaging.
| Measurement Type | What it Measures | Life Sciences Relevance |
|---|---|---|
| Emission Spectrum | Fluorescence intensity across emission wavelengths at a fixed excitation wavelength. | Identifies emission peaks and helps characterize fluorophores. |
| Excitation Spectrum | Fluorescence intensity at a fixed emission wavelength while excitation wavelength is varied. | Helps select the best excitation wavelength for assays. |
| Steady-State Fluorescence | Average fluorescence intensity under continuous excitation. | Used for routine quantification, assays, and sample characterization. |
| Time-Resolved Fluorescence | Fluorescence decay after pulsed excitation. | Used for studying lifetime, protein dynamics, interactions, and quenching. |
| Fluorescence Anisotropy | Polarization of emitted fluorescence. | Used for binding studies, molecular rotation, and interaction analysis. |
| FRET | Energy transfer between donor and acceptor fluorophores. | Used to study protein-protein interactions, molecular distance, and conformational changes. |
| FLIM | Fluorescence lifetime in imaging format. | Used in cell imaging and microenvironment analysis. |
Factors Affecting Fluorescence Intensity
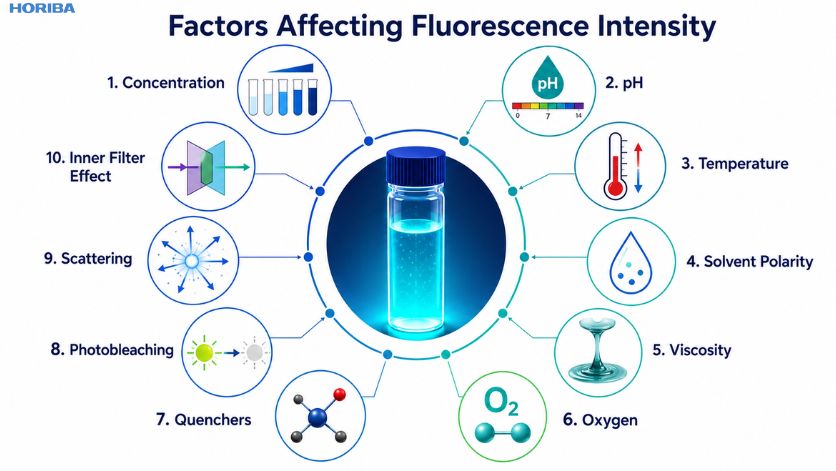
Fluorescence intensity is influenced by both molecular and experimental factors. Understanding these factors is important for accurate measurement, reproducibility, and interpretation of results.
| Factor | Effect on Fluorescence | Practical Note |
|---|---|---|
| Concentration | Fluorescence intensity generally increases with concentration only within a linear range. | High concentration can cause self-quenching or inner filter effect. |
| pH | Can change fluorophore structure, charge state, and emission behavior. | Use stable buffer conditions for sensitive assays. |
| Temperature | Higher temperature may increase molecular collisions and reduce fluorescence intensity. | Use temperature control for kinetic and biological studies. |
| Solvent Polarity | Can shift fluorescence wavelength and change intensity. | Choose solvent carefully and maintain consistency between samples. |
| Viscosity | Higher viscosity may reduce collisional deactivation and increase fluorescence. | Important in protein, membrane and polymer studies. |
| Oxygen | Can quench fluorescence/phosphorescence in many systems. | Degassing or oxygen control may be required for sensitive measurements. |
| Quenchers | Can reduce fluorescence through collisions, energy transfer or complex formation. | Check sample matrix for halides, metals, oxygen or interacting molecules. |
| Photobleaching | Continuous light exposure can reduce fluorescence over time. | Reduce excitation intensity and exposure duration. |
| Scattering and Turbidity | Particles can scatter excitation or emission light and increase background. | Clarify, filter or centrifuge samples where appropriate. |
| Inner Filter Effect | Highly absorbing samples may prevent uniform excitation throughout the sample. | Dilute samples and validate the linear measurement range. |
Applications of Fluorescence Spectroscopy in Life Sciences
Fluorescence spectroscopy is widely used in life sciences because it can detect specific molecules with high sensitivity, even at low concentrations. By using natural fluorophores, fluorescent dyes, labeled probes, or fluorescence-based assay systems, researchers can study biological molecules, cellular processes, and molecular interactions.
Protein Analysis
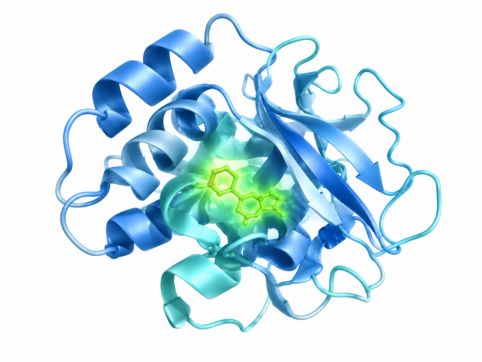
Used to study protein folding, conformational changes, aggregation, stability, and binding interactions. Changes in fluorescence intensity, emission wavelength, or lifetime can indicate changes in the protein environment or structure.
DNA and RNA Analysis
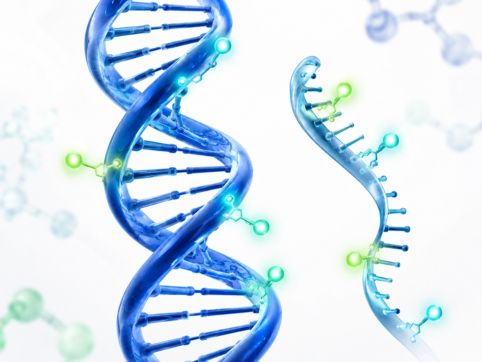
Fluorescent dyes and probes are commonly used for nucleic acid quantification, DNA/RNA melting studies, hybridization assays, and nucleic acid binding analysis. These methods help detect small changes in nucleic acid structure and concentration.
Enzyme Activity Assays
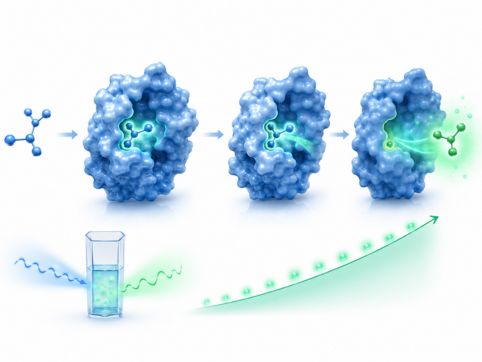
Enzyme assays often use fluorescent substrates or products. As the reaction proceeds, fluorescence intensity changes, allowing researchers to monitor reaction rate, enzyme kinetics, inhibition, and substrate conversion.
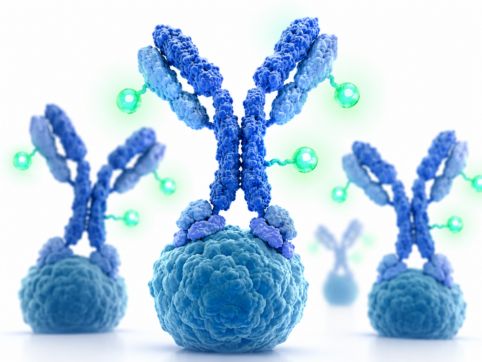
Immunoassays
Fluorescence-based immunoassays are used to detect antigens, antibodies, biomarkers, and other biological targets. Fluorescent labels provide sensitive readouts for diagnostic, clinical research, and pharmaceutical applications.
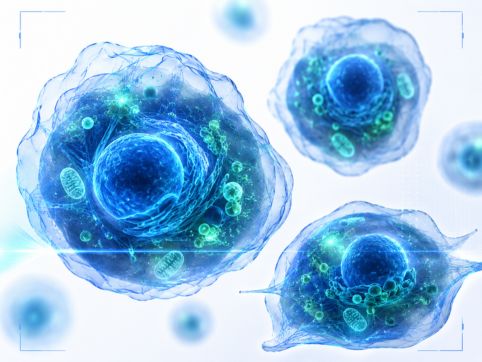
Cell Analysis and Imaging
Supports cell-based studies by enabling the measurement of fluorescent probes, intracellular ions, cellular signaling events, viability indicators, and live-cell labels. It also helps visualize biological structures and processes.
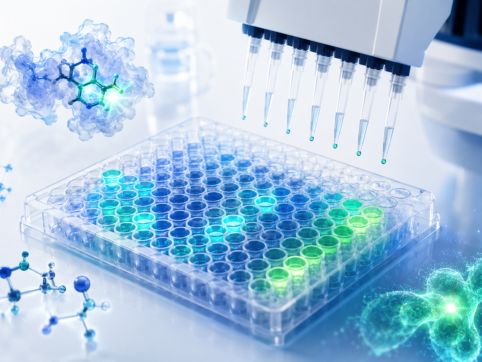
Drug Discovery and Screening
Used for high-throughput screening, target engagement studies, protein-ligand binding, enzyme inhibition, drug candidate characterization, and stability testing in pharmaceutical research.
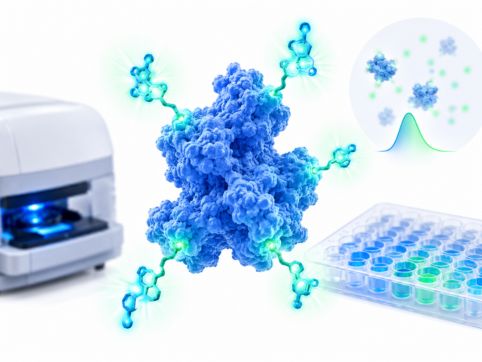
Biomarker Detection
Fluorescence-based detection systems are useful for measuring biomarkers in biological samples. High sensitivity makes the technique suitable for low-abundance targets and assay-based detection platforms.
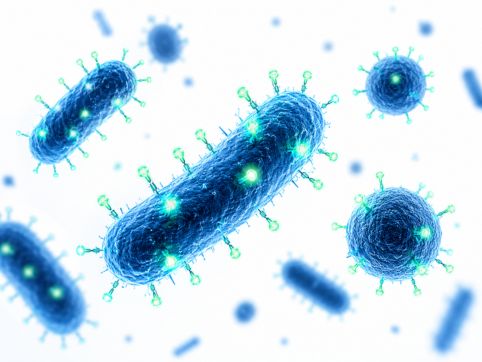
Microbiology and Pathogen Detection
Fluorescent assays can be used to detect bacterial strains, microbial viability, metabolic activity, and pathogen-related markers, making fluorescence useful in microbiology, infectious disease research, and assay development.
Relevant Fluorescence Spectroscopy Solutions by Application
Fluorescence spectroscopy requirements vary depending on the application. For example, protein studies may require high sensitivity and lifetime measurements, while cell analysis or assay workflows may need flexible sample handling, microplate compatibility, or advanced measurement modes. The table below provides a practical application-wise view of suitable fluorescence spectroscopy solutions.
| Application Area | Typical Requirement | Relevant Product / Solution |
|---|---|---|
| Protein analysis and molecular interactions | High sensitivity, fluorescence intensity, lifetime and interaction studies | Steady state Fluorescence spectrofluorometer / fluorescence lifetime system |
| DNA/RNA and nucleic acid studies | Fluorescent dye/probe-based quantification and melting analysis | Steady-state fluorescence spectrometer with temperature control |
| Enzyme assays and kinetics | Real-time fluorescence monitoring and kinetic data acquisition | Fluorescence spectrometer with kinetic measurement capability |
| Immunoassays and biomarker detection | Sensitive fluorescence readout for labeled assays | Fluorescence detection system / microplate-compatible fluorescence setup |
| Cell analysis and imaging-related studies | Fluorescent probes, intracellular analysis and advanced detection modes | Fluorescence spectrometer, confocal fluorescence microscope and fluorescence lifetime-based solutions |
| Drug discovery and screening | High sensitivity, binding studies, protein stability and assay screening | Fluorescence spectrometer with accessories for biological and pharma workflows |
| Advanced research applications | FRET, anisotropy, time-resolved fluorescence and lifetime analysis | Modular fluorescence spectroscopy system with advanced measurement options |
Advantages and Limitations of Fluorescence Spectroscopy
Fluorescence spectroscopy is widely used because of its high sensitivity and selectivity, especially in life sciences and analytical research. However, like any analytical technique, it also has certain limitations that should be considered during method development and result interpretation.
| Advantages | Limitations |
|---|---|
| High sensitivity: Detects very low concentrations of fluorescent molecules, making it suitable for trace-level analysis. | Not all compounds fluoresce: Some molecules require fluorescent labeling or derivatization. |
| High selectivity: Specific excitation and emission wavelengths help selectively target particular molecules. | Autofluorescence: Biological samples may contain natural fluorophores that interfere with the target signal. |
| Non-destructive analysis: Many fluorescence measurements can be performed without destroying the sample. | Quenching: Oxygen, halides, metals, or molecular interactions may reduce fluorescence intensity. |
| Suitable for biological samples: Compatible with biomolecules, cells, probes, assays, and fluorescence-based workflows. | Photobleaching: Prolonged exposure to excitation light may reduce fluorescence signal over time. |
| Quantitative capability: Fluorescence intensity can be correlated with concentration within a validated linear range. | Environmental sensitivity: pH, solvent, temperature, viscosity, and ionic strength can significantly affect fluorescence behavior. |
| Real-time monitoring: Useful for kinetics, binding studies, and reaction monitoring in real time. | Inner filter effect: Highly absorbing samples can distort quantitative fluorescence measurements and reduce accuracy. |
| Versatility: Supports steady-state, time-resolved, anisotropy, FRET, imaging, and other advanced measurement modes. | Overlapping spectra*: Complex samples may contain multiple fluorophores with overlapping emission signals. |
HORIBA A-TEEM™ Spectroscopy for Complex Fluorescence Analysis
In conventional fluorescence spectroscopy, samples with complex or overlapping fluorescence features can be difficult to interpret, especially when multiple fluorescent components are present in the same sample. HORIBA’s patented A-TEEM™ spectroscopy helps address this challenge by combining absorbance, transmittance, and fluorescence excitation-emission matrix measurement in a single analytical approach.
A-TEEM™ spectroscopy can generate molecular fingerprints of complex samples and support the study of overlapping fluorescence features. This makes it useful for advanced research, quality control, biopharma analysis, environmental studies, and applications where multiple fluorescent signatures may be present together.
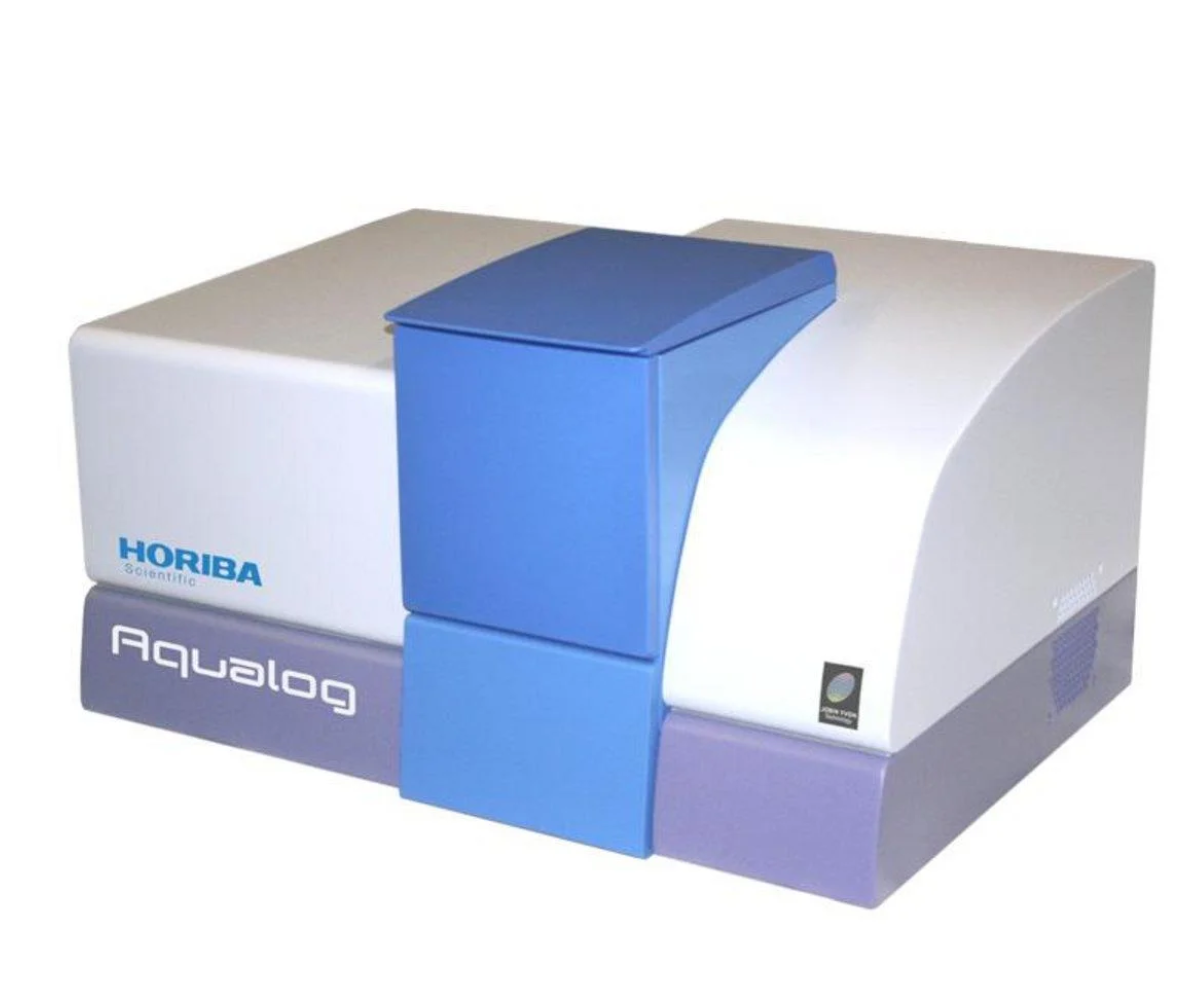
Aqualog®-Next
Advanced A-TEEM™ system for fluorescence EEM, absorbance measurement, and complex sample fingerprinting.
Explore Now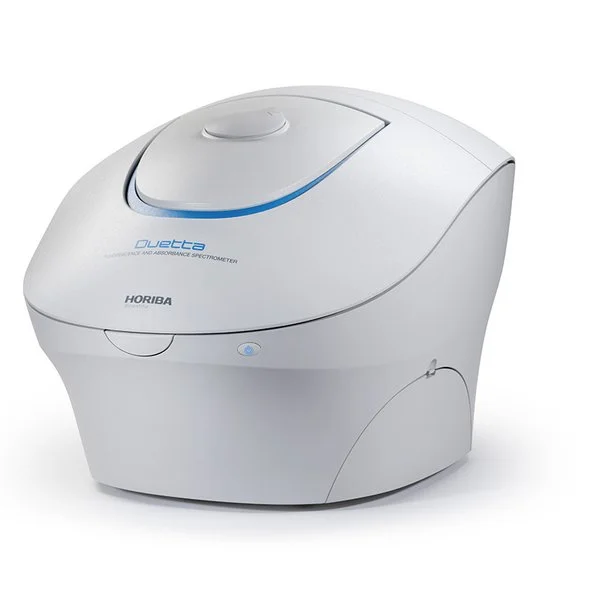
Duetta™
Compact fluorescence and absorbance spectrometer for fast screening, concentration correction, and routine analysis.
Explore Now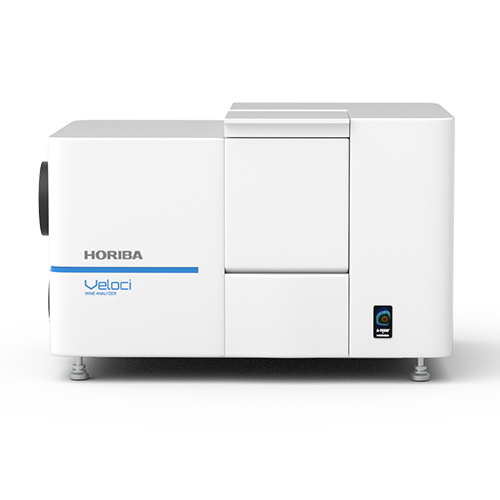
Veloci A-TEEM™ BioPharma Analyzer
Column-free molecular fingerprinting solution for fast biopharma and pharma QC/QA analysis.
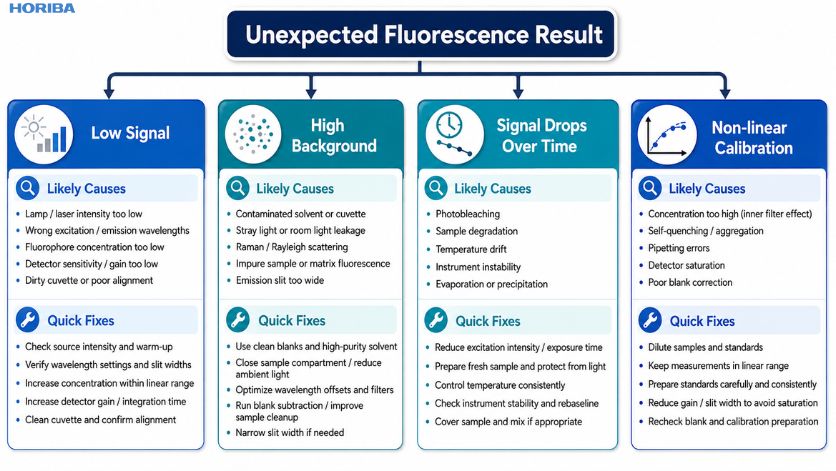
Explore NowCommon Problems in Fluorescence Measurements and How to Avoid Them
Fluorescence measurements can be highly sensitive, but the same sensitivity also makes them vulnerable to experimental errors. The table below summarizes common issues and practical corrective actions.
| Problem | Possible Cause | Suggested Solution |
|---|---|---|
| Low fluorescence signal | Low fluorophore concentration, wrong excitation wavelength, weak quantum yield | Optimize excitation/emission wavelengths and increase concentration within the linear range. |
| High background signal | Autofluorescence, contamination, stray light or poor blank correction | Use proper blanks, clean cuvettes, suitable filters and background correction. |
| Signal decreases over time | Photobleaching or sample instability | Reduce exposure time, lower excitation intensity and protect samples from light. |
| Non-linear calibration curve | High concentration, inner filter effect or self-quenching | Dilute samples and validate the linear dynamic range. |
| Poor repeatability | Sample positioning, temperature variation or inconsistent preparation | Use fixed holders, consistent sample preparation and temperature control. |
| Unexpected quenching | Oxygen, halides, metal ions or interacting molecules | Check sample matrix, remove interfering substances and control experimental conditions. |
Fluorescence Spectroscopy vs Related Techniques
Fluorescence spectroscopy is often compared with UV-Visible spectroscopy, Raman spectroscopy, infrared spectroscopy, chemiluminescence, and phosphorescence methods. Each technique measures a different type of interaction between light and matter.
| Technique | What it Measures | Key Difference from Fluorescence |
|---|---|---|
| UV-Visible Spectroscopy | Absorption of light | Fluorescence measures emitted light, often with higher sensitivity. |
| Raman Spectroscopy | Inelastic scattering of light | Provides vibrational information; fluorescence provides emission-based information. |
| Infrared Spectroscopy | Molecular vibrations | Useful for functional group analysis; fluorescence is stronger for sensitive detection of fluorophores. |
| Chemiluminescence | Light produced by chemical reaction | Does not require external excitation light. |
| Phosphorescence | Delayed light emission | Emission continues longer than fluorescence. |
Need Support for Fluorescence Spectroscopy Applications?
For laboratories working in life sciences, biotechnology, pharmaceutical research, clinical research, or molecular analysis, fluorescence spectroscopy can support highly sensitive detection, characterization, and quantification of fluorescent molecules.
Explore suitable fluorescence spectroscopy solutions and application support for your research and analytical requirements.
References
- Joseph R. Lakowicz Principles of Fluorescence Spectroscopy
- Microbe Notes Fluorimetry: Principle, Instrumentation, Factors, Uses.
- Ossila Fluorescence Spectroscopy: Theory, Instrumentation & Uses.
- BMG LABTECH Fluorescence Intensity Measurements.